Experiments with Strava MCP
I love analyzing my cycling data.
I’ve spent countless hours over the years poring over ride and race performance on Strava, Zwiftracing.app, Zwiftpower.com and Intervals.icu, so when I learned about the Strava Model Context Protocol (“MCP”) server by R.Huijts, I had to test it out.
The MCP lets Claude talk directly to your Strava account and analyze your data in ways the Strava UI can’t.
This MCP server exposes Strava data and functionalities as “tools” that Large Language Models (“LLMs”) can utilize through the MCP standard.
Test 1: Analyzing eight years of Prospect Park data
👉 Explore the interactive visualization here
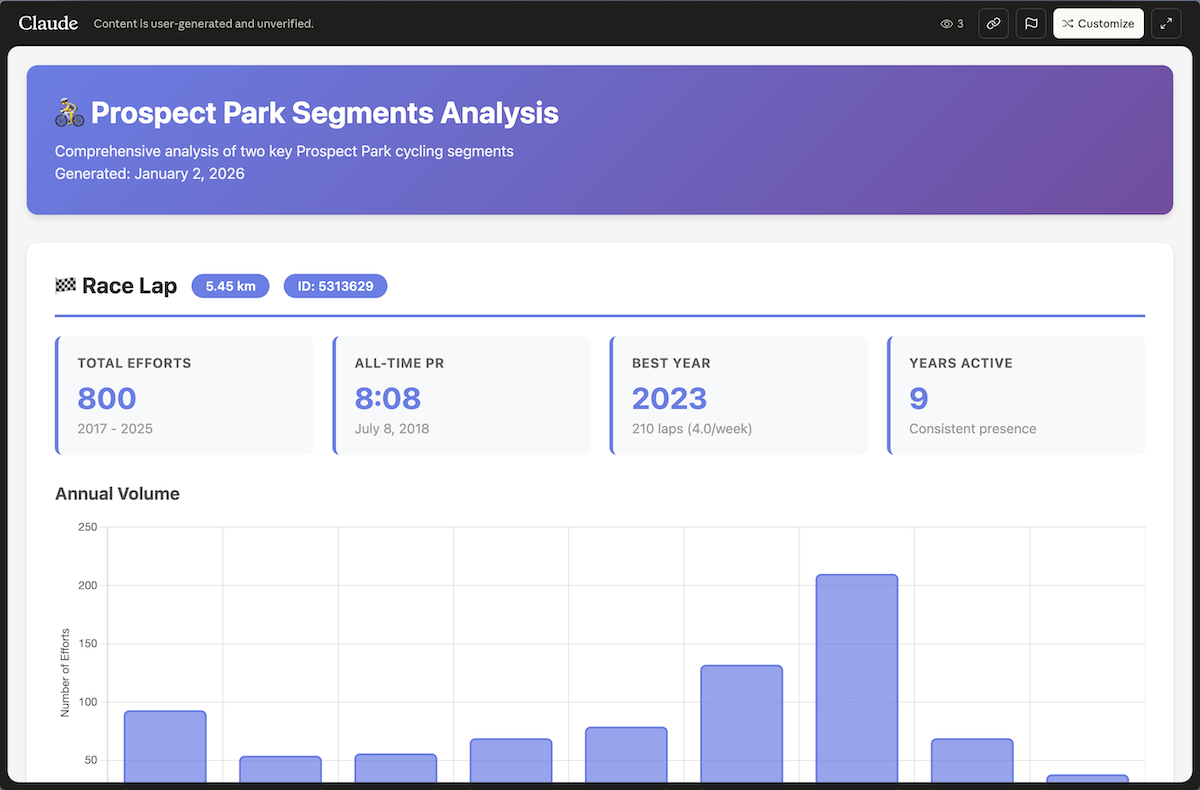
This interactive visualization analyzes eight years of my performance across my two favorite Prospect Park segments - the Prospect Park race lap and the Prospect Park hill climb - with detailed breakdowns by year, PR progression tracking, and interactive charts.
I picked these two segments because they’re where I do 90% of my outdoor training. The race lap shows my overall fitness trends, and the hill climb reveals my power on the hardest ~90 seconds of each loop. Together, they tell the story of my outdoor riding over eight years.
The data in this output didn’t reveal anything shocking, but seeing it visualized, year by year, with my PR progression charted out made it very clear a) I need to get more outdoor riding in this year and b) with some focused training perhaps I can regain my 2023 form once again.
The starting prompt I used to generate this analysis was:
Search my Strava data for all my efforts on the Prospect Park Race Lap segment (ID 5313629). Start by finding my earliest effort on this segment, then query each year from that first year through the current year. If any year returns exactly 200 results, chunk it into half-years to get the complete count. Show me my total laps per year, best time each year, and create a visual chart showing my PR progression and volumeI followed this prompt up with this secondary ask resulting in the visualization containing information on both segments.
In addition to the Strava race lap data we've analyzed can we now also add in the prospect park hill segment (ID 613198) to the same visual chart? Start by finding my earliest effort on this segment, then query each year from that first year through the current year. If any year returns exactly 200 results, chunk it into half-years to get the complete count. Show me my total laps per year, best time each year, and create a visual chart showing my PR progression and volumeThese prompts work well because they are specific (segment ID, time range) and tell Claude exactly what to calculate and visualize. Vague prompts like “show me my Strava data” won’t get you much.
Shoutout to Eiwe Lingefors for giving me the original prompt (and also testing the MCP server in parallel with me).
Test 2: Analyzing recent race performance
I know I want to get better at racing, so power data across specific segments and areas I want to improve on is incredibly valuable. This MCP connection to Strava opens up a whole new world of that kind of exploration.
I used the following prompt to kickstart a conversation on analyzing my recent races on Zwift:
Help me understand my power data from my races since 12/1/2025, the races should have "race" in the strava activity title. I want to understand what parts of my power profile are strong and where I should focus training work.I combined this prompt with a follow up of:
what charts or visuals can you create to help me understand my recent race performances?The charts and analysis I got back during this conversation were useful for helping me understand my current baseline.
Below is one of the charts Claude put together showing my per race power outputs against my max power changing over the analysis window.
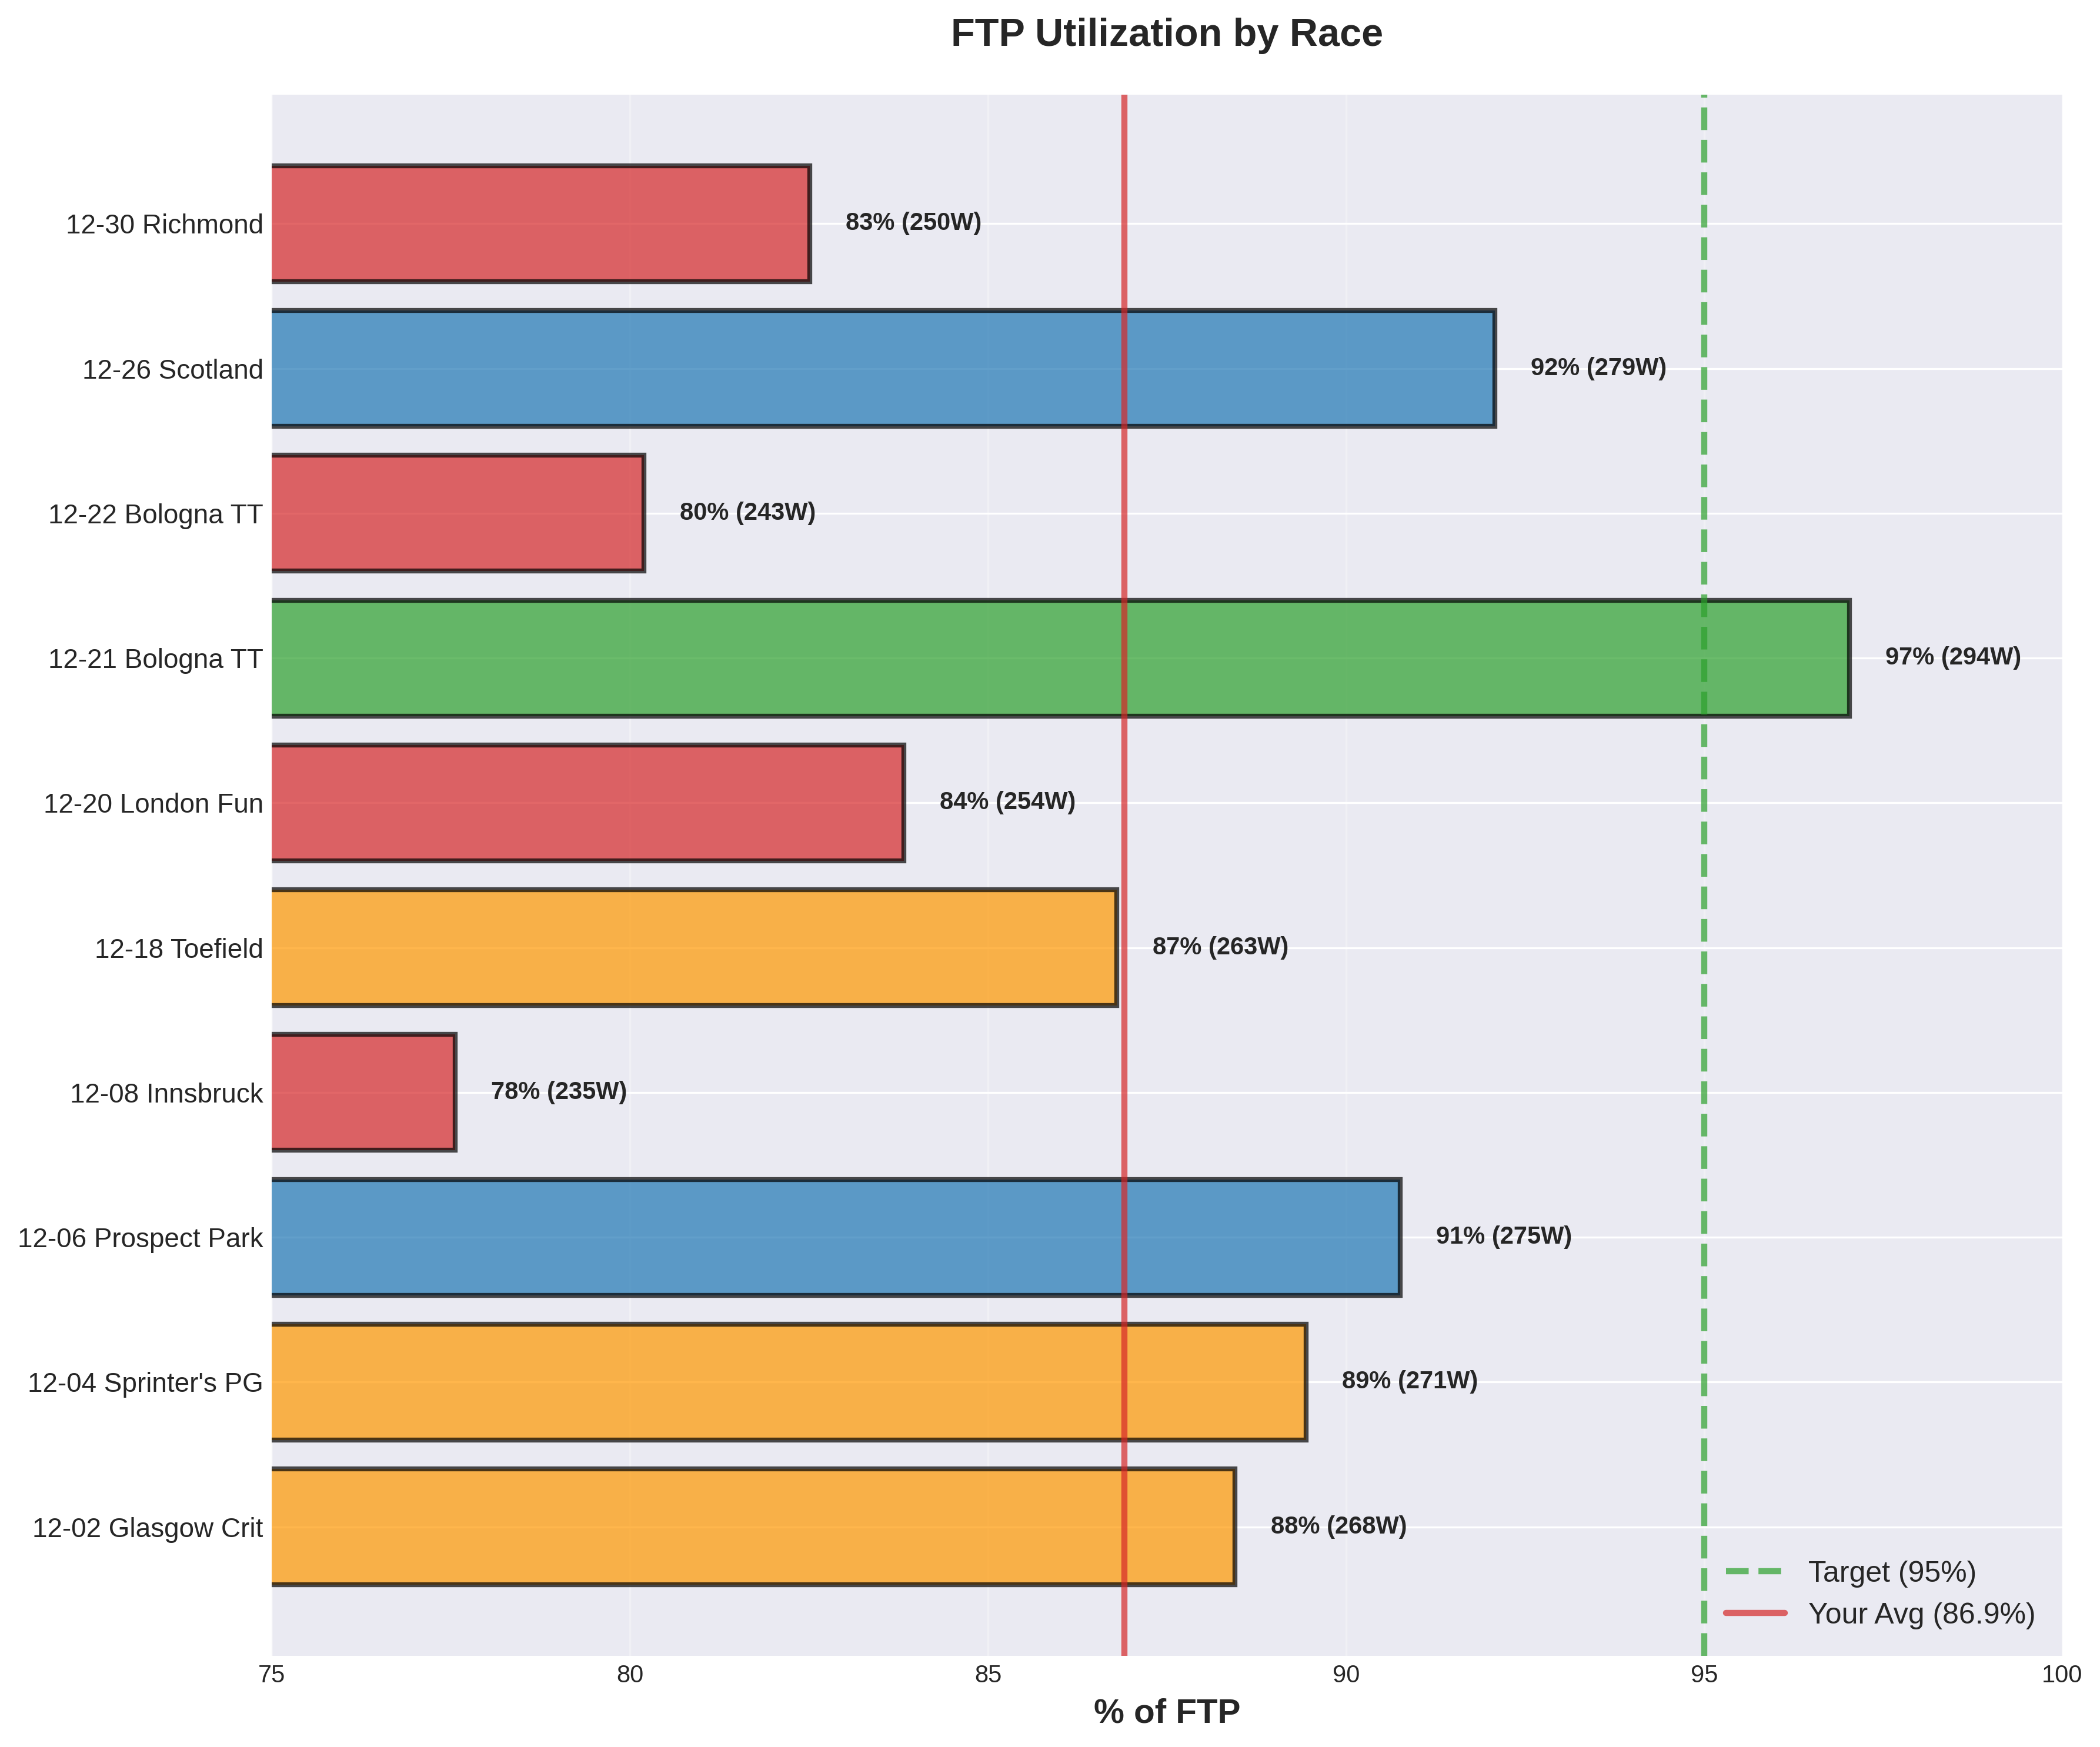
Part of the observations Claude shared was that in my recent races I had been underperforming vs past weeks. This made a ton of sense as during the holidays I was on the bike less and not as focused on training and racing.
Impressions after testing
My opinion after testing this for a bit is the Strava MCP is incredible for digging into individual sessions, going deeper into charts and data, and exploring segments and routes. If you don’t know what to ask, you can brainstorm with the LLM on what goals you might want to pursue and what data you can sort through.
The key benefit of using the MCP is that you can have a conversation with your data. You’re not limited to whatever views Strava has built into their UI. You can ask follow-up questions, request different visualizations, combine data in ways that make sense for your specific goals.
Other observations
My cycling friends love going down the rabbit hole with their cycling data as well. That said, it does seem the setting up of the MCP server and connecting it to an LLM is a significant hurdle most were not willing to endure.
It’s not that the setup is impossibly hard, but it is annoying if it’s not tooling you are used to interacting with. You need to create a Strava API application, get your credentials, install the MCP server, configure Claude… for someone who doesn’t spend their days tinkering with developer tools, it feels like work.
The future I’m hoping for is one in which connecting Claude to Strava (or whatever other application you enjoy) is as easy as clicking a button and authorizing access.
If you are interested in testing out this MCP, follow the steps below.
How to Set It Up
The first version of this MCP server took me ~15-30 minutes to set up. The creator of the MCP made some great improvements and now the full process takes ~10 minutes or less to get set up. Updated instructions below.
Step 1: Create a Strava API Application
-
Click “Create an App”
-
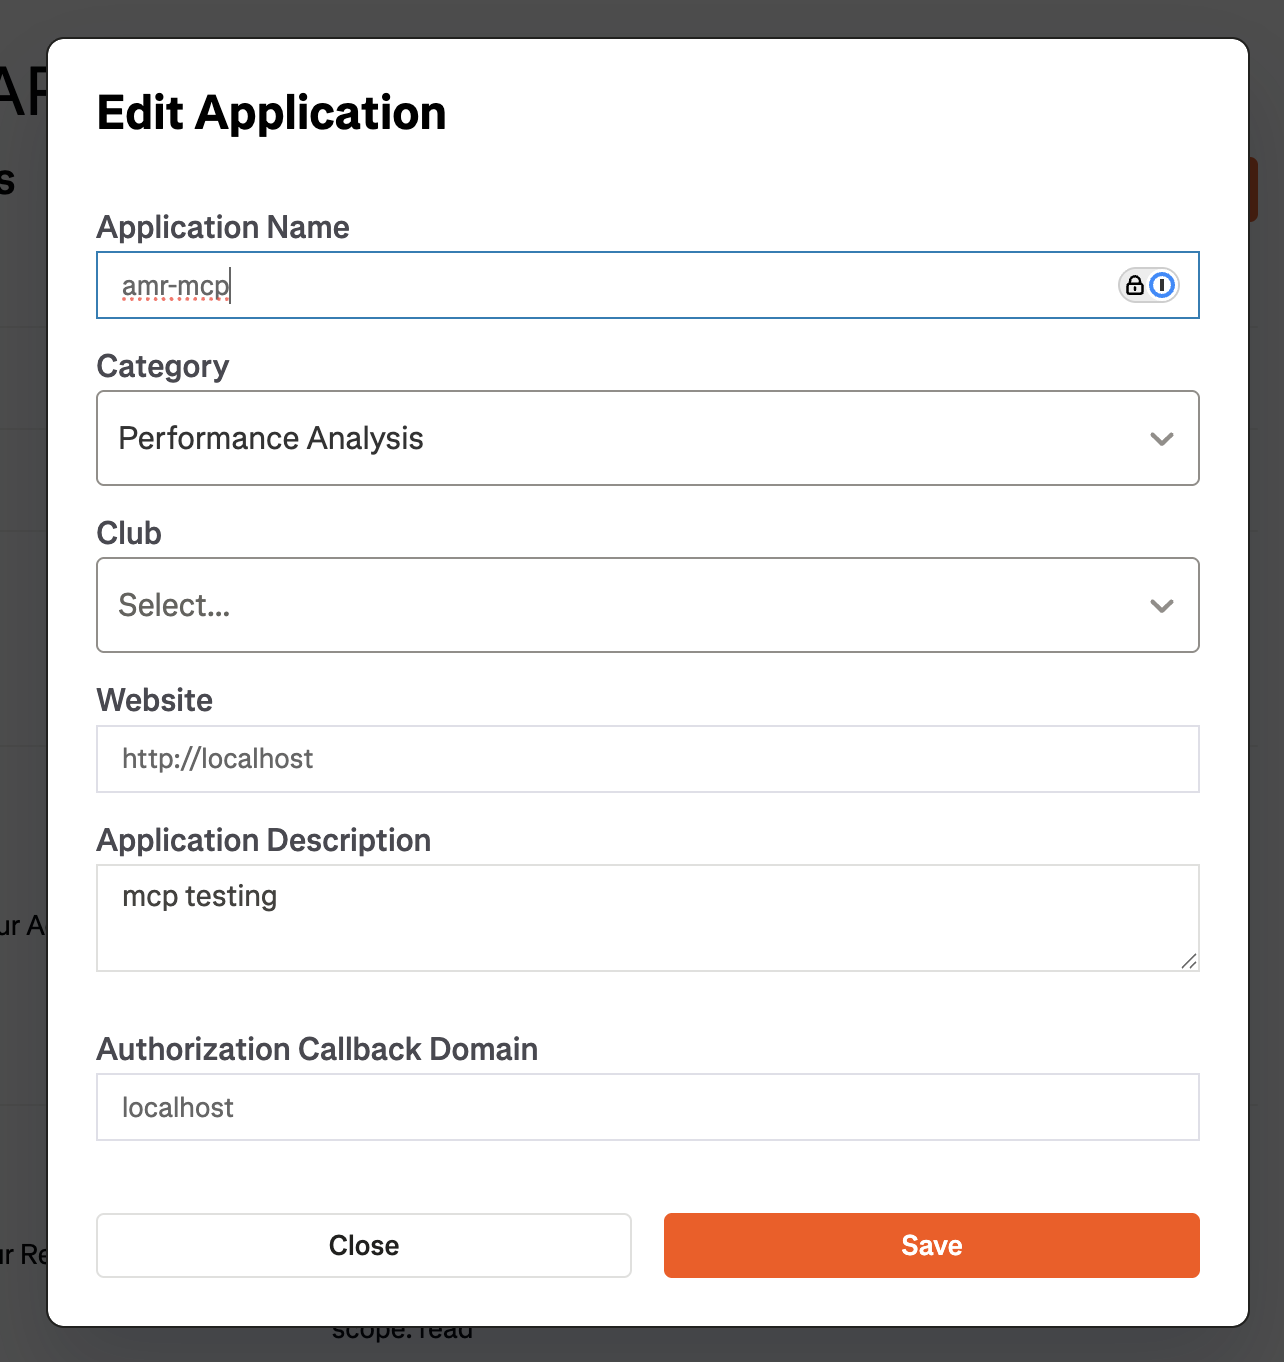
Fill in the form:
- Application Name: Something like “My Strava MCP”
- Category: Choose what fits, I used “Performance Analysis”
- Website: Can be anything (e.g.,
http://localhost) - Authorization Callback Domain: Must be
localhost(not 127.0.0.1)
-
Save and note down your Client ID and Client Secret (you’ll need that to connect your Strava account)
Step 2: Configure Claude Desktop
Find your Claude Desktop config file:
- macOS:
~/Library/Application Support/Claude/claude_desktop_config.json - Windows:
%APPDATA%\Claude\claude_desktop_config.json
Edit the file to add the Strava MCP server:
{ "mcpServers": { "strava": { "command": "npx", "args": ["-y", "strava-mcp-server"] } }}Save the file, then completely quit Claude Desktop (Cmd+Q) and restart it.
If you already have other MCP servers set up, just add a comma after the previous server’s closing brace and add the Strava configuration.
Step 3: Connect Your Strava
Just say to Claude:
"Connect my Strava account"
A browser window will open. If it doesn’t automatically open, visit http://localhost:8111/auth
Once you have the localhost window open, enter your Strava API credentials (the client ID and the client secret):
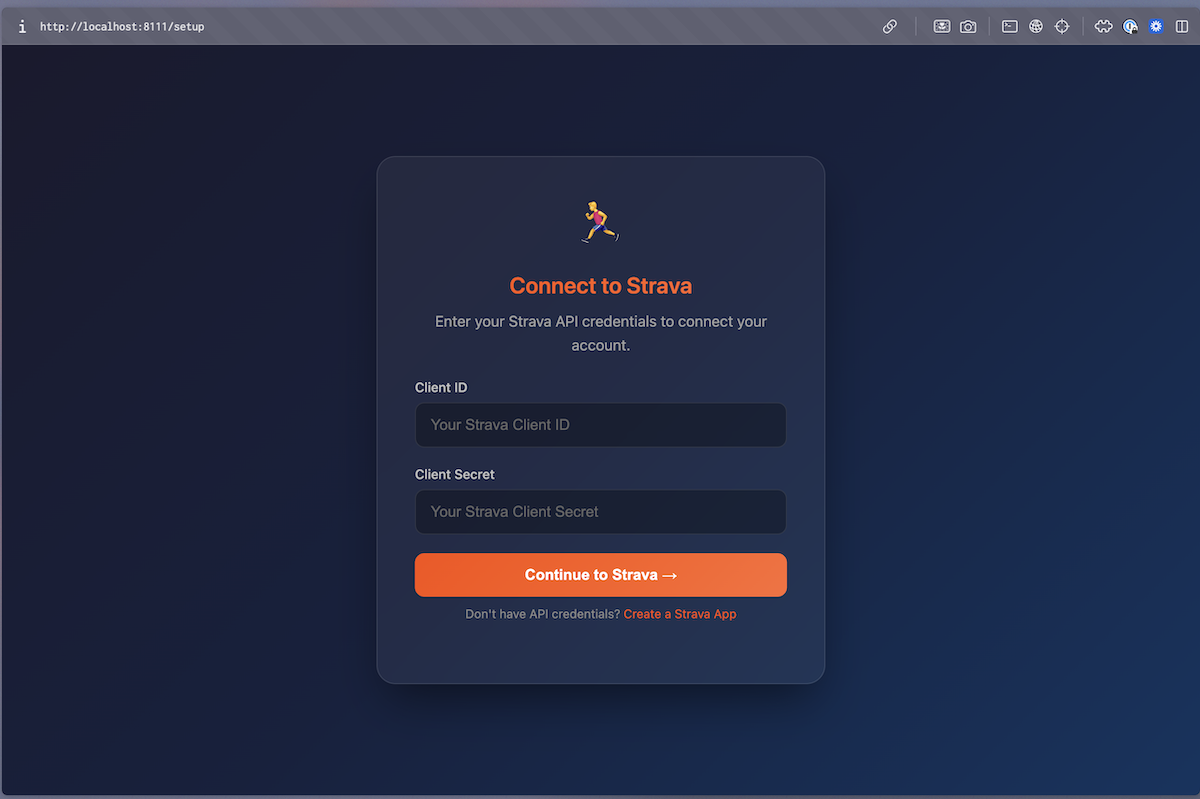
Authorize the app:
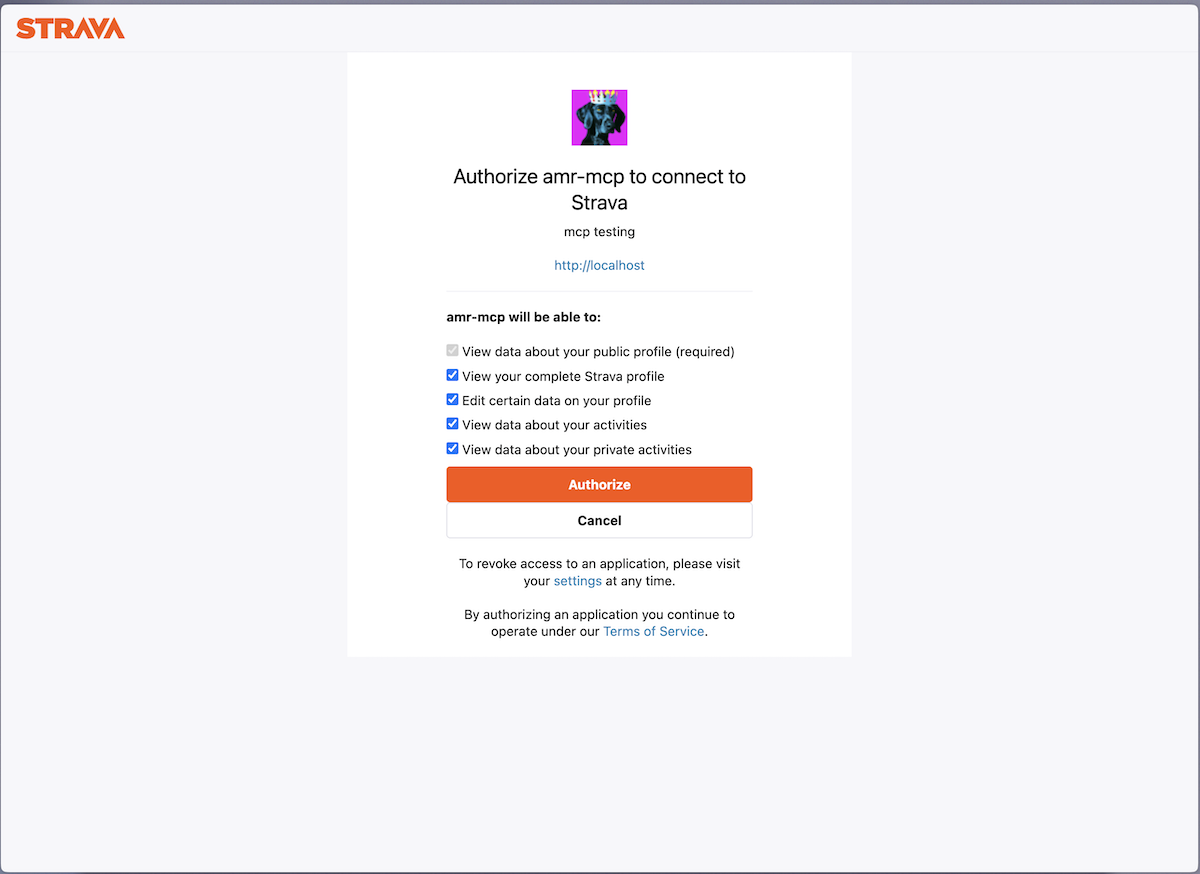
Once authorized, you should be good to go.
Step 4: Test It
Open Claude and ask: “Show me my recent Strava activities” or “Which Strava profile do you have access to?”
If it works, Claude will pull your Strava profile and/or activity data and display it.

That’s it! You’re now set up and ready to explore your Strava data far beyond what you could do in Strava alone.
If you run into any issues along the way, screenshot or copy and paste your error messages directly into Claude and just ask for help.
What’s Next
For me? Getting more laps in at Prospect Park so that 2026 chart looks better.
While I love the community-driven MCP servers, I’m also hoping for official MCP servers from Strava and Zwift.
I’m just at the beginning of exploring what this MCP server could do against my data but one idea I plan to explore ASAP is creating training plans to fit my goals and available time to train in the spring.