Vibe coding a Tour de France app using Replit and Google Sheets
This past week, while watching the last stages of the Tour de France, I vibe coded (vibe coding = instructing instructing AI agents to write code) up an alternative UI for a fantasy competition using a combination of Replit and Google Sheets.
I recently took this Vibe Coding 101 class and wanted to apply some of the lessons to something real. Each year, my friends and I participate in a fantasy competition during the Tour de France where we each pick different riders and attempt to have the team with the lowest time after the 21 stages of the race. The riders on our team might change over the duration of the race and each day new results are posted the competition needs to account for.
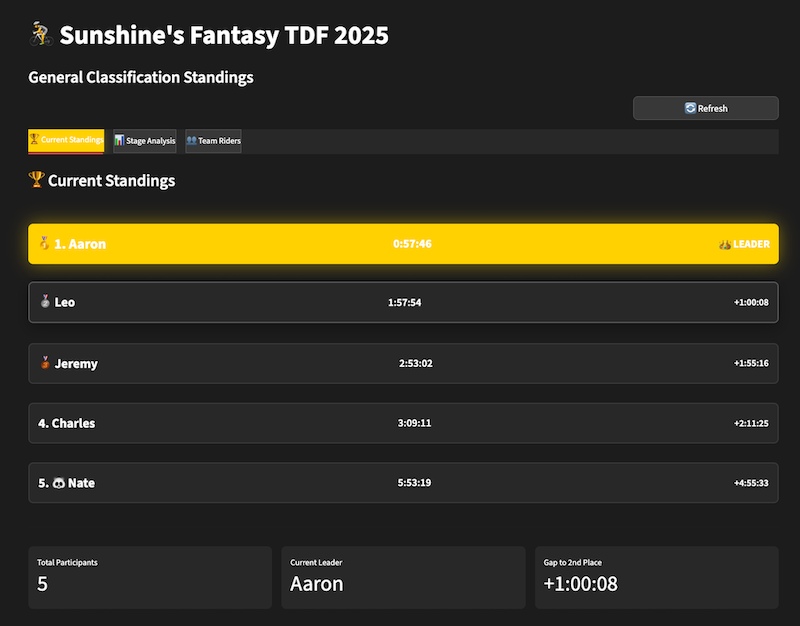
In the past, we would use Google Sheets to track our respective teams, but the site I spun up offers more interactivity than having tracked this in Google Sheets alone, and more importantly, has flashy UI elements to let my friends know my team is crushing it.
You can check out the working app here. NOTE: This application was moved off Replit and over to streamlit via claude code since this article was first written.
Here are some detailed notes on how I built it and what I learned.
Building the initial application
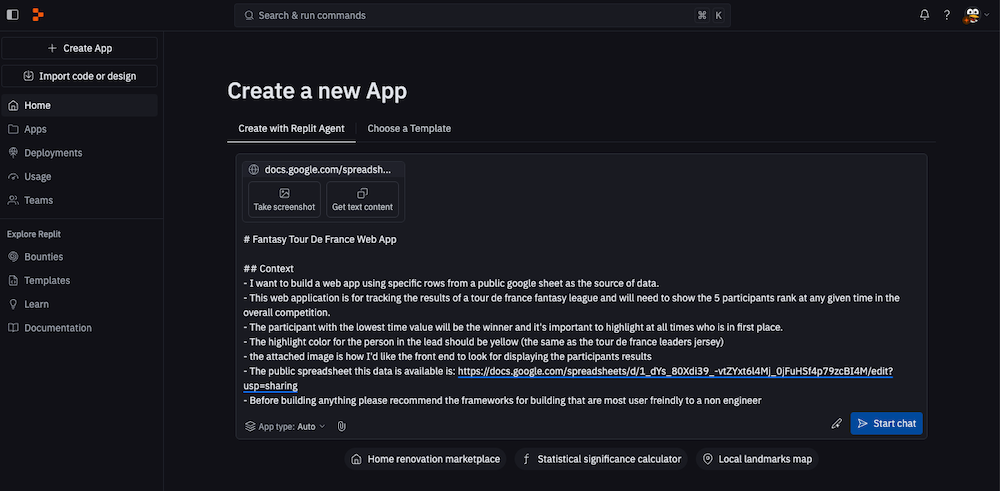
Step one was creating the prompt to use with the Replit Agent to kickstart this project. I wrote this prompt in markdown in Visual Studio Code and then just copy and pasted it right into Replit. I attached a screenshot of how I wanted the results to look alongside the Replit prompt.
Original prompt:
# Fantasy Tour De France Web App
## Context- I want to build a web app using specific rows from a public google sheet as the source of data.- This web application is for tracking the results of a tour de france fantasy league and will need to show the 5 participants rank at any given time in the overall competition.- The participant with the lowest time value will be the winner and it's important to highlight at all times who is in first place.- The highlight color for the person in the lead should be yellow (the same as the tour de france leaders jersey)- The attached image is how I'd like the front end to look for displaying the participants results- The public spreadsheet this data is available is: [google docs link]- Before building anything please recommend the frameworks for building that are most user freindly to a non engineer
After a few moments, the Replit agent came back with a proposed implementation plan breaking down the tech stack (leveraging the Google sheet as the data source, as I requested) and suggested features to include in the initial version vs later iterations. Before starting the implementation plan, I could change whether or not features were in scope for the MVP, and chat with the agent to ask questions or make further modifications to the implementation plan.
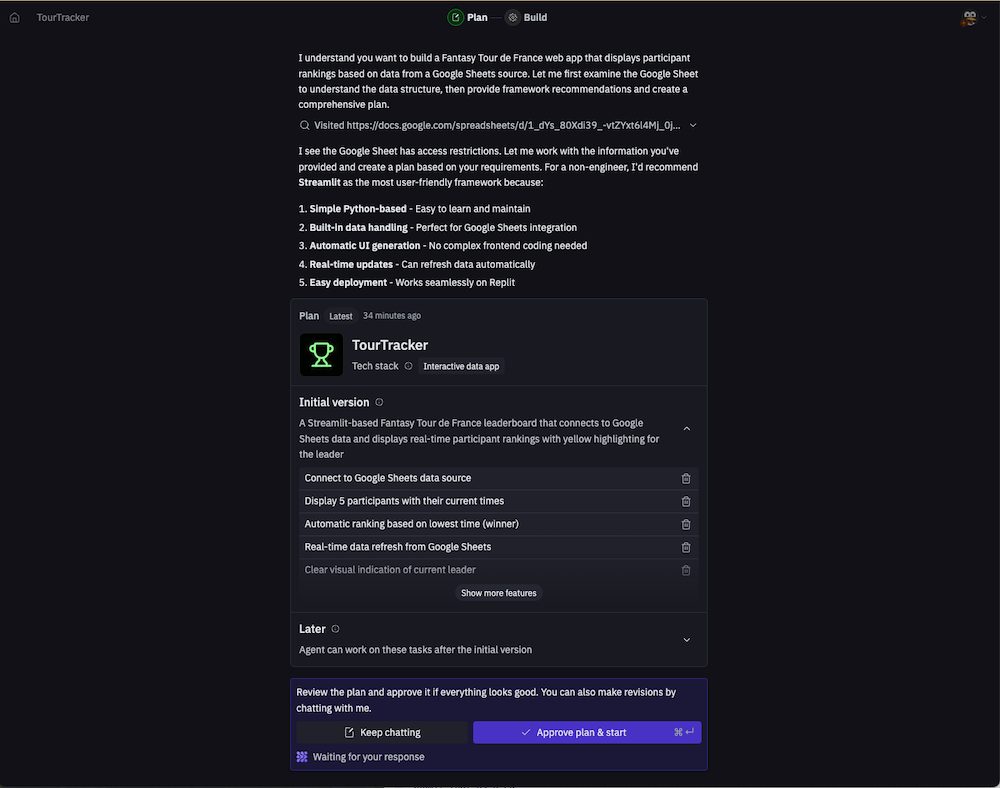
Once I approved the plan, the agent got right to work spinning up my project as a python web application.
Replit provides a helpful preview window within the application so you can see how your current code will render. After the first pass, this is what my application looked like, as you can see, it’s got all sorts of issues, and something is amiss with the Google Sheets connection, thus no data is being pulled in.
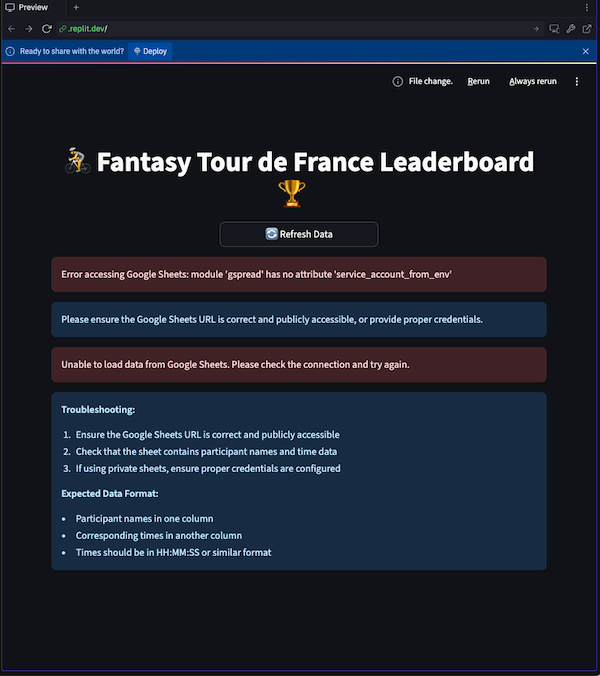
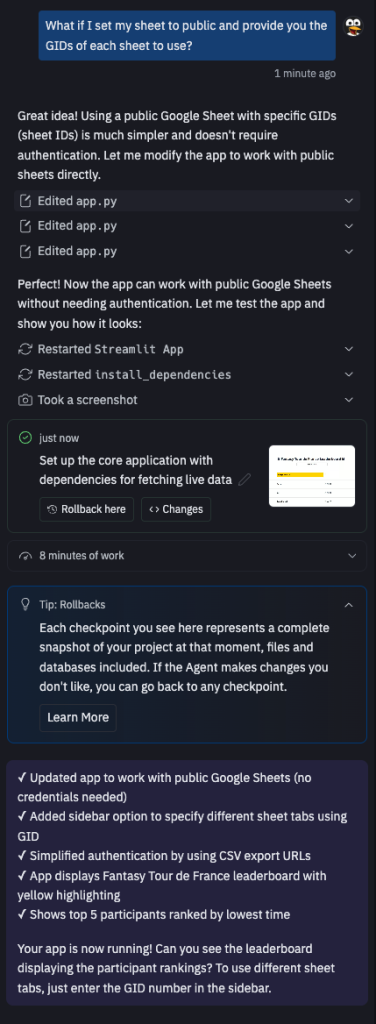
Debugging and solving this data integration issue is where the Replit agent really helped me out, as I was able to screenshot what I saw in the preview window, and then ask the agent to suggest ways of fixing the issue. It turned out I needed to set my Google sheet to public and make sure to provide the exact GID for each worksheet my site needed to use for connecting data.
Once I had the Google Sheets data integrated into the Replit app so that data could be fetched in real-time, I was able to shift focus to layering on fancy UI elements and usability improvements. At this moment, I backed up this entire project into GitHub. The agent was also able to provide me with instructions on what I needed to back up. Using GitHub with Replit is not a required step, but I wanted the option to take this project with me somewhere else should I decide not to keep using Replit in the future.
Deploying and sharing the project
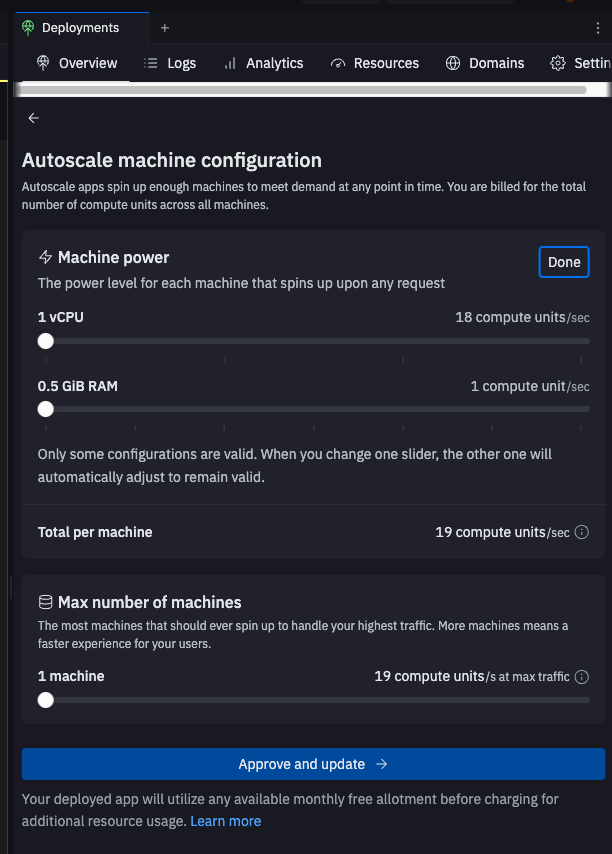
Within Replit you can publish your app and deploy it for sharing on a Replit sub-domain or on a custom domain if you have one. You leverage Replit’s cloud infrastructure, and they will handle the rest. I used a bit too much machine power at first (I only needed minimums but had it set to use slightly more), and out of the ~$16 I spent on this project, the majority was on deployment costs.
Adding more features
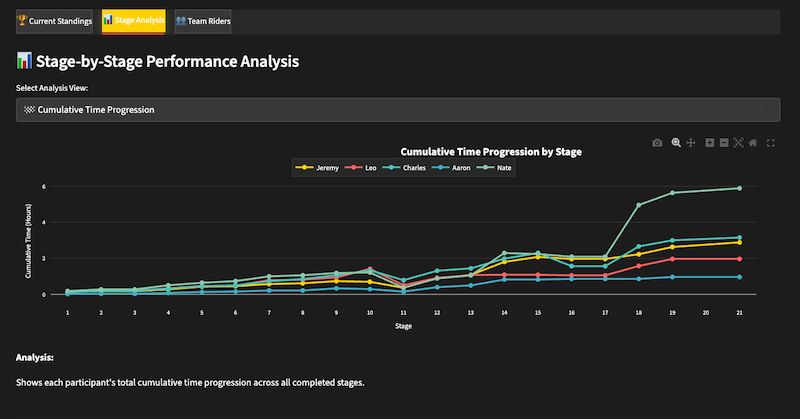
One of the best practices (at least according to Reddit) in using Replit is spinning up a new agent chat for each new feature so that the agent can focus on just the task at hand. I spun up new agent chats to first layer on stage by stage analysis charts and then create a team section within the app.
The checkpoints feature in Replit is pretty helpful, each checkpoint represents a moment in time you can roll back to. I used this a few times as I layered on additional functionality and made mistakes. Once I had features in working order and ready for deployment, I could easily redeploy from within Replit and pull down all my files for pushing over to my Github repo.
Replit Agent vs Replit Assistant
I primarily used Replit agents for this project (what they recommend for going from 0-1). Replit launched an assistant that’s cheaper to use than the agents and what they recommend for taking projects from “1-10”. I did not find the assistants to be particularly helpful for this project but that might be my own ignorance on how to use it versus the actual utility of the tool.
Where I ran into issues
- Parsing and formatting data. I spent far too much time trying to figure out how to real-time sync data from Pro Cycling Stats to my site, and after trying a few different methods (via API and web scraping), decided to just stick with updating the Google worksheets manually once a day, as the site was easy to refresh with updated data. Finding the data sources was not the problem per se, the quagmire I got stuck in was in formatting time duration to match the intended output I needed. I am sure a more talented developer could crack this with ease but alas this is a vibe coding writeup and not an engineering blog.
- Accessibility and UI tweaks. I found using the agent to be overkill for fixing potential CSS issues (it would change large swaths of code in attempts to remediate UI issues) and conflicts and the assistant was ineffective at resolving issues as I brought them up. Ultimately, I had to pop into the app.py file and use ChatGPT as a helper to play with the various CSS settings to try and resolve some of the issues (and ended up not resolving some of them altogether).
How much did this cost?
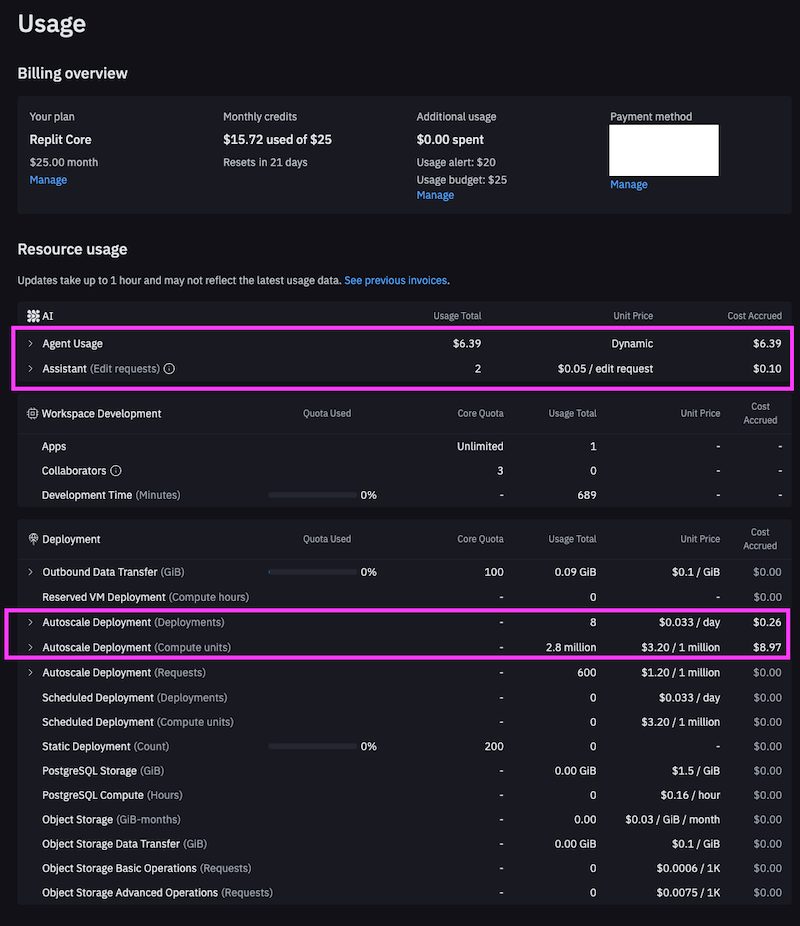
Usage breakdown below, including hosting I’ve spent about ~$16 on this project on Replit thus far (and a few hours of my divided attention while watching Tour de France stages).
What’s next with this project?
I found the whole experience similar to playing Factorio, as I learned more things, I constantly wanted to rip things out and start back over with an improved foundation.
I built this just for fun but can imagine repurposing it for the any of the cycling grand tours (the Vuelta is coming up in August) or at the very least dusting it off for use next year. I skipped layering on any security or authentication considering we’re using all public data but might want to add that into future iterations of this project. Additionally, should I find the time I really want to revisit connecting this into the procycling stats API so the data for each rider updates in real-time at the conclusion of each stage vs relying on a human updating the connected google sheets.
Other resources you might want to check out:
- Simon Willison’s Weblog (I’ve learned so much about AI and the latest development of tools from this blog)
- Lovable (Similar to Replit for vibe coding sites up, seems to be focused on great UIs)
- Bolt (Next up for testing with!)